I was excited. I was going to boost customer engagement for our analytics app for non-coders. This was gonna be a fun project. Our retention and growth was gonna skyrocket, and I was going be the hero.
But quickly I felt some tricky little questions sneak up on me..
Questions like: "How am I going to measure User Engagement?" and "What is our current User Engagement"? Which led to more questions like "What is an Active User"?
Reality hit as I realised there are so many ways you can measure User Engagement - and a lot of Chinese sounding acronyms like W1, WAU and MAU.
What was the difference between a WAU and a MAU? How would I know which was right for me? Already this was harder than I thought...
So I wrote this article to capture what I learned. I really hope it helps you.
TL;DR In this article I'm going to cover:
- how User Engagement affects Growth
- the most common User Engagement Metrics, like DAU, WAU, MAU, the DAU/MAU Ratio, Day 1, Day 7, & Day 30 User Retention
- Retention Curves,
- the importance of W1 User Retention
- as well as tripwire metrics and a testing strategy to improve user engagement.
User Engagement leads to Retention, so if you want a strategy for Customer Retention, go here. Ok, lets get started...
Also, if you want to listen online, click the player below:
Definition: What is user engagement?
Lets start by defining what User Engagement is and User Engagement Actions and why you should care.
Lincoln Murphy says user engagement is "when your customer is realising value from your SaaS." More generally you can say "user engagement is when your customer is realising value from your product/service/website/app".

A good way to measure the value customers gain is their use of key User Engagement Actions. If a user is consistently performing key User Engagement Actions it is a good indication of engagement.
Key User Engagement Actions are specific to each product, so you'll need to decide for your own business, but to give you an idea here are a few examples of certain types of User Engagement Actions for some different online businesses:
- Team Collaboration APP: Add Task, Complete Task, Invite Team Members
- A/B Test SaaS App: Create Test, Start Test, End Test, Share Results
- Online Billing APP: Create Invoice, Send Invoice, Receive Payment
- Publish an Event: For our own product our Key User Engagement Action is when users Publish a User Tracking Event.
So if you can measure your User Engagement by tracking User Engagement Actions, and then use that data to test and improve your user engagement, you are on the road to growth.
How User Engagement affects Growth
User Engagement impacts profoundly the growth of your business, on multiple levels. If users are getting value then they are going to stay around for longer. And if you can retain each user for longer, you will have more opportunity to generate revenue from each user (meaning a greater Lifetime Value, so you can afford a higher cost of Customer Acquisition) and more opportunity to have each user refer other new users - all of which leads to growth.
Put simply, User Engagement leads to Retention, which leads to Revenue and Referrals, both of which lead to Growth.
Common App and Website Engagement Metrics
Every business is different, and your users will behave differently from those of other businesses. Don't just blindly adopt the following metrics, instead think about how useful they may be, or how there my be something similar in your business, and then focus in on one (or two) to measure.
You may try a few metrics until you find the best one for your business, but it’s totally worth it.
CASE STUDY: How one website used User Engagement Metrics to increase Sales 14.3%
Learn how marketer and growth hacker Rosanne used engagement and conversion data to grow sales 14.3% in 24 weeks.
USER ENGAGEMENT METRIC 1: DAU, WAU, MAU
DAU, WAU, MAU stand for Daily, Weekly, and Monthly Active Users, that is the unique amount of users who are "active" within a given amount of time.
DAU and MAU metrics have been used for years by websites and reflect the most basic way of measuring user engagement.
To use them well, you need to pay attention to the following:
(1) How you define Active User
The key lies in how you define "active" user. Is "user signed" in enough to define a user as "active"? Perhaps its better to to measure a more valuable action like "Update a Task", "Invite Collaborator", "Share Content" (see above). Lincoln Murphy goes into more detail on this here and its worth reading to better define your active users.
(2) By ignoring the absolute numbers and looking at the ratio
Some folks think DAU and MAU are pseudo vanity metrics and many have rejected them as meaningless. (Mixpanel calls them "bullshit metrics'). But, you can take more value by not looking at the absolute numbers, but by comparing the Daily Active Users with Monthly Active Users to calculate "stickiness" which is a measure of how much users are engaging with the product.
USER ENGAGEMENT METRIC 2: Stickiness, The DAU/MAU Ratio

Stickiness is generally calculated as the ratio of Daily Active Users to Monthly Active Users. A DAU/MAU ratio of 50% would mean that the average user of your app is using it 15 out of 30 days that month.
USER ENGAGEMENT METRIC 3: D1, D7, D30 User Retention
D1, D7 and D30 retentions are calculated as the percentage of users who are active at any time after 1 day, 7 days and 30 days of signing up or installing your app.
This is often shown in tabular form in tools like Woopra, Mixpanel and KISSmetrics cohorts analysis, but the most useful way to model the data though is as a Retention Curve.
Take a look at the sample Retention Curve shown below. This curve shows the percent of users that remain active after a period of time.

The retention curve has two key features:
- it tends to drop off really fast at the start (more later on this)
- the curve then (hopefully) tends to flatten out over time. If instead of flattening it hits hit zero, its a strong signal you urgently need to improve user engagement.
This is an incredibly useful way to measure your user engagement, and the aim over time is to move the curve upwards by working to improve your user engagement, both at the start when new users signup, as well as over time.
UPDATE (1): Amplitude is the only tool I'm aware of where you can quickly see the curve (please correct me if you know other tools that generate these curves!).
UPDATE (2): I wrote this article to show you how to create Retention Curves using Mixpanel Cohorts Data and Google Sheets.
USER ENGAGEMENT METRIC 4: Focus on W1 User Retention
Most new users are lost at the beginning, a short time after signup. For website and web-apps, typically 60-80% of new users are lost within the first week of signup. In mobile it can be 70-80% users lost after the first day.
Brian Balfour (Hubspot) says that 7 day, or "Week 1 Retention (W1)" "has one of the biggest impacts on your retention over time" because improvements that you make in week 1 retention carry through the entire retention curve.
Basically if you can get more people to engage early with your product, that will have a a ripple effect pulling the entire curve upwards (as shown in the arrow), so you'll keep more customers, and hence grow faster. Nice!

Improving this metric is all about figuring out how to quickly get new users to experience the core value of the product in that critical first week. And the more people you get to experience that core value really quickly the more those users will tend to engage and retain with your product.
If you want to use Retention Curves Demonstrate how your Retention is improving via Engagement messages, here's an earlier the article I wrote to show you how to create User Retention Curves using Mixpanel Cohorts Data and Google Sheets so you can see the improvement.
USER ENGAGEMENT METRIC 5: Tripwire Metrics: Using 'Red Flags' to Engage Users
Typically users don't ask for help, and tend to drift away if they don't get value quickly. If you can spot those users and reach out, you may be able to engage them. To help spot users who aren't engaged, you can use Tripwire Metrics to identify users who aren't engaging well and use that data to quickly act to engage them during those vital first 7 days.
The guys at Groove managed this, and were able to engage 10% of those users. They noticed that users who engaged well (and were therefore significantly more likely to become paying customers) spent an average of 3 minutes and 18 seconds in the first session, and logged in an average of 4.4 times per day, whereas those who were not engaged (and unlikely to convert) only spent an average of 0.35 seconds on their first session and logged in 0.3 times/day.
So, they set up an alert to spot these non-engaged users and would then reach out to those users to offer personalised help getting setup which resulted in those users becoming more engaged and 30% of those who responded would then convert to a customer.
Here's a template email you could use (it's based on the Groove email below):
Hi John,
I got an alert that you might be having trouble setting up ____________.
If so, I'd love to help. Just reply to this and let me know.
Thanks,
Shannon
Here's the actual email used by Groove to engage "red flag" users:
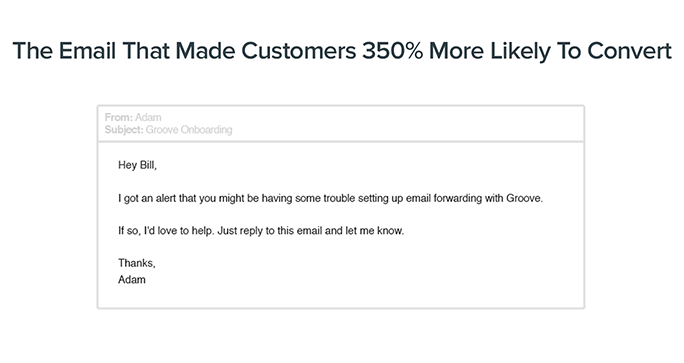
IMAGE CREDITS: Groovehq.com
Have a think about what user engagement metrics you could use as tripwires to alert you about users that aren't engaged so you could reach out. For example, you could automate an email like this for a user who hasn't performed a Key User Engagement Action within 1 or 2 days of signing up.
Whats Next? How to Improve user Engagement
Now you know what to measure, the next thing you'll need is a strategy to help you improve your users engagement and you can do a lot of that with both email and in-app messages.
READ NEXT: A 7 Step Strategy to Improve User Engagement using Email and In App Messages
P.S. Want to understand user behaviour on YOUR website?
Like any Growth Hacker worth her salt, are you trying to optimise your website conversions?
Do you want insights on your website user behaviour? Or to see which behaviours are likely to lead to a conversion? Or to create conversion funnels?
Or are you trying to measure which is your best revenue channel? Click below to find out how.
Thanks for reading to the end! If you liked this, this I'd appreciate shares and retweets.
If you think I've missed something, or if you have a different view, I'd love to hear from you in the comments below.
And if you don't want to miss my next post just leave your email here or drop it in the box below.