As a growth focused online marketer, you probably pay a fair amount of attention to your customer acquisition channels. Knowing which channels perform the best helps you decide where to focus your marketing efforts. Without this information you won't know which marketing efforts are producing your best results.
One key piece of data that is crucial to our marketing is knowing WHERE our customers come from. And one of the best ways to see that is via the Google Analytics “Channels” report.
Why I Love The Google Analytics “Channels” Report
I love the Google Analytics Channels Report, because at a fundamental level, I want to know how our new customers discover Popcorn Metrics. The better we understand our acquisition channels, the more focused we can execute on those specific channels.
OK THIS BIT IS IMPORTANT: The GA Channel Report is ONLY valuable to me if I combine it with Goals. I'm not that interested in just know "where" traffic comes from. I want to know about behaviour, I want to know where our Signups come from, where our paying customers come from. That's essential to me. So, we track key funnel events like "Register", "Publish Tracking" and even "Subscribe" as events, and then map those to Goals in Google Analyiycs. That way we can quickly see which channels drive the most engaged users and ultimately Paying Customers.
For example,in the excerpt below, you can see that over 40% of our Signups (this is our Register Goal) come from SEO. Great - thanks to our content marketing.
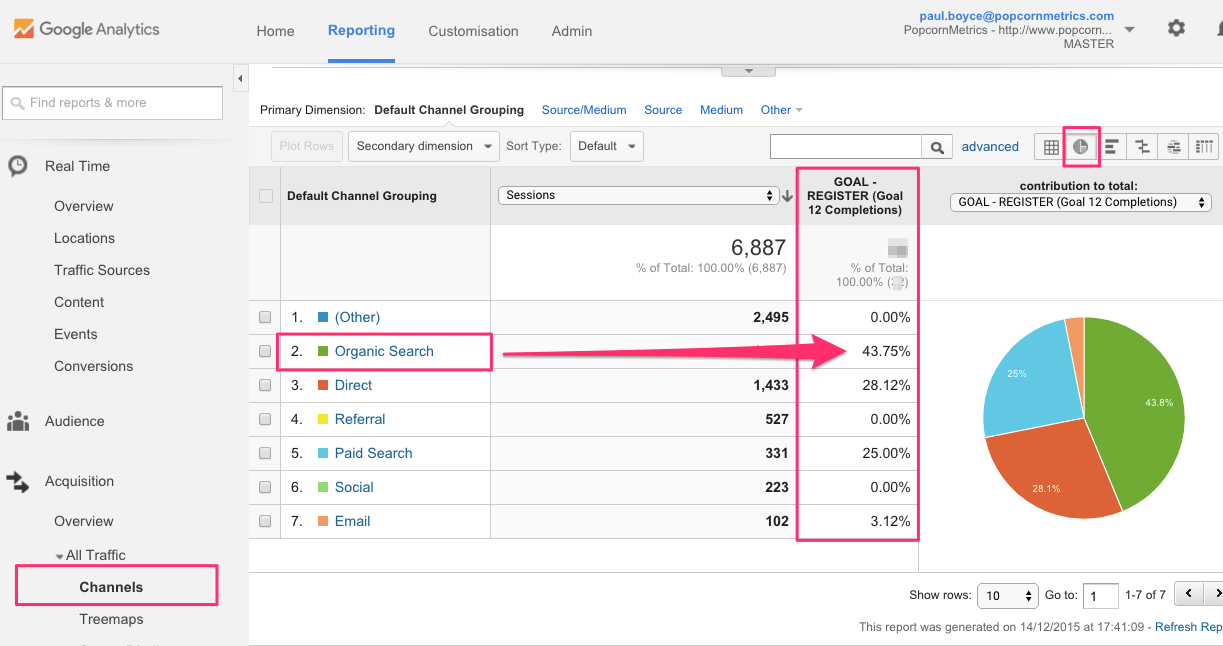
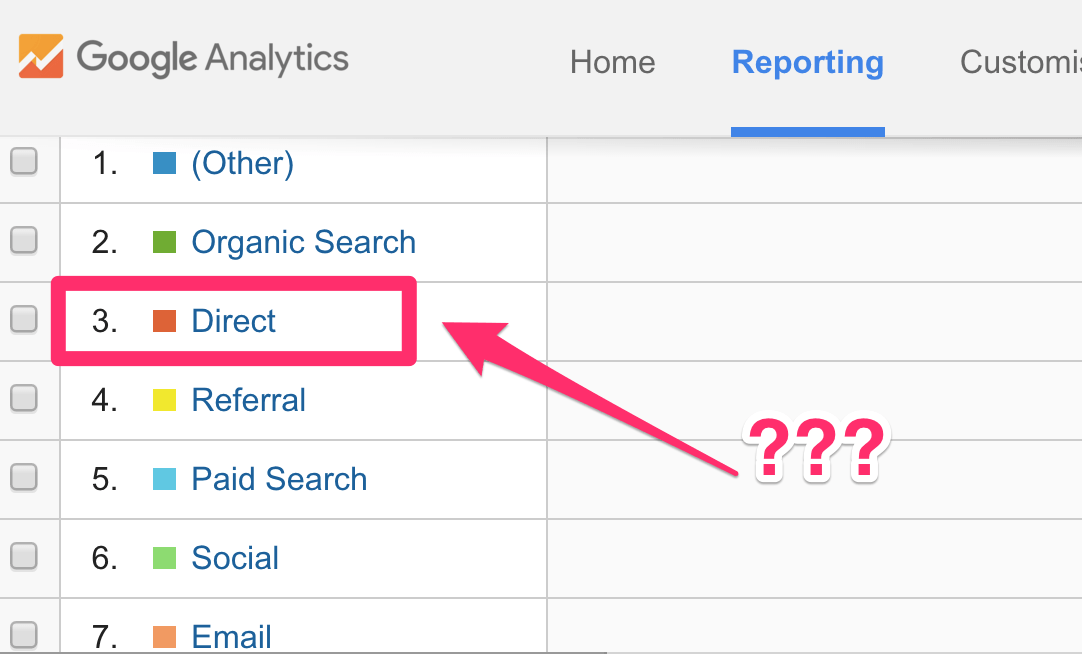
But here’s where we’ve constantly run into a problem that I’d be willing to bet you’ve also encountered: Source = Direct. “AarggghhHH!!!!”
Look more closely at the image below, and you'll notice, fully 28% of our signups are from the Direct Channel Grouping. That's a whopping amount of signups for which we have no source information.
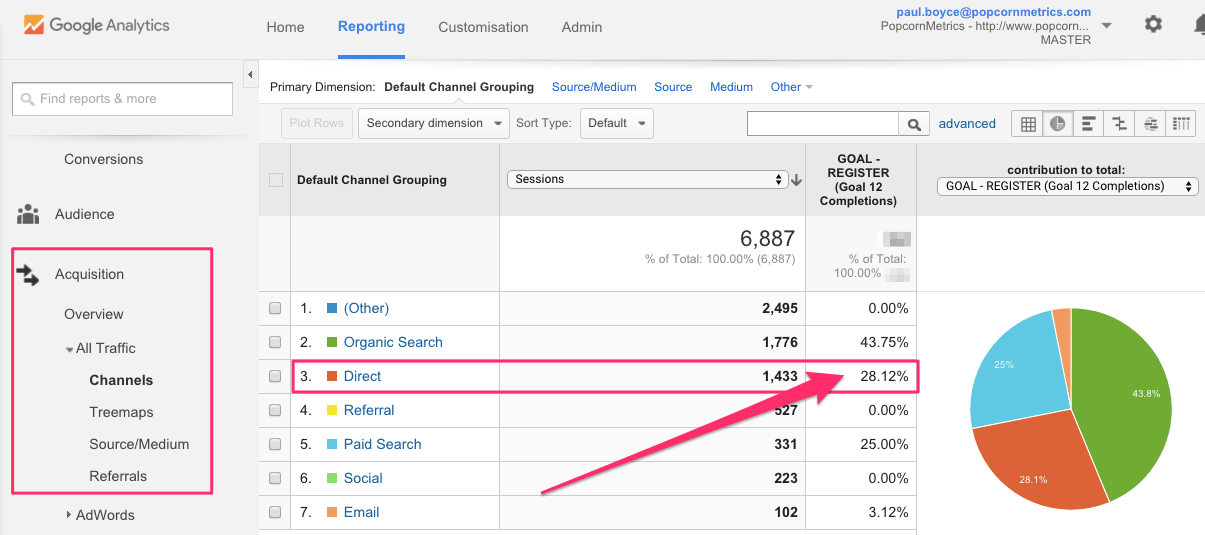
Google Analytics Direct Traffic
Direct sessions occur when Google Analytics cannot determine the source referrer. There are a number of causes including:
- visitors type your full website address direct to their browser
- visitors click a link to your website in an email (or PDF) - and that link doesn't have [UTM Params](https://ga-dev-tools.appspot.com/campaign-url-builder/" target="_blank), ([UTM Builder instructions here](https://prateekagarwal.com/google-url-builder/" target="_blank))
- visitors arrive from an HTTPS site to an HTTP site
For more detail, here's a deeper explanation on the [source "direct" problem](https://megalytic.com/blog/understanding-direct-traffic-in-google-analytics" target="_blank).
How we Set About Solving the Direct Traffic Grouping
Without further ado, hera are 5 steps we took - that you can apply today.
1. SEO Clean Up / Branded Searches
Previously, we had excluded branded searches (for "Popcorn Metrics") from our Organic Search results, because we had wanted to clean up our Organic Search to only show non-branded search traffic by excluding people entering our brand name into Google.
![we excluded branded searches for "Popcorn Metrics" from our SEO results] (GHOST_URL/content/images/2015/12/search-term-exclusion-list-in-google-analytics-admin-min.png).
But when you do that, Google Analytics pushes these branded searches into the "Direct" grouping, which only amplifies the problem of Direct Traffic, because so many people use Google Search as a shorthand to websites - our included.
In retrospect, I think that was perhaps not a good idea, and we’re going to revert that and allow Branded SEO results back into the Organic Search channel grouping. The goal is to account for all channels, and Direct I can’t account for. Branded searches should show as Organic Search channel. They give visibility on SEO traffic that is branded vs non-branded, and help us get closer to zero Direct Traffic channel.
You can read more [about Search Term exclusions here](https://support.google.com/analytics/answer/2795833" target="_blank).
2. We shifted from HTTP to HTTPS.
One of the reasons traffic source data is “Direct” occurs when people arrive at an HTTP website from a website that is HTTPS.
Sites that run on HTTPS (like GrowthHackers.com and Quora.com) won’t pass source information when people visit your site via link from any site running on HTTPS -- if your site is HTTP.
As soon as we switched from HTTP to HTTPS we started getting visibility on our traffic from {HOLD GH and Q etc}. That reduced our Direct traffic but didn’t kill it completely.
In retrospect we should have done this a long time ago. (Hat-tip to my friend [Paulo Teixeira](https://twitter.com/ftpaulone" target="_blank) at [Landing.Jobs](https://landing.jobs/" target="_blank) for pushing me on this.)
If you aren’t running your website via HTTPS, I recommend you change to HTTPS soon. It takes a little configuration work and you’ll spend a little cash on SSL certificates, but it’s totally worth it.
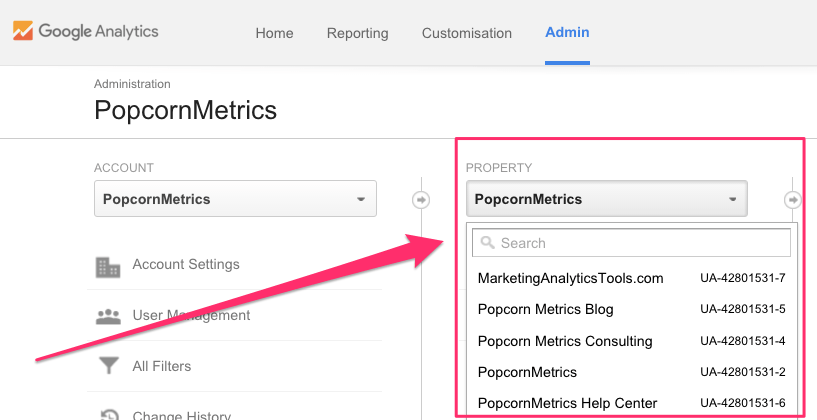
3. We combined our Google Analytics across All Sites.
We used to have a separate Google Analytics Property for our Marketing Pages, our Blog, Our App and even our Help Docs. These were effectively 4 different web destinations, all with different purposes, so we wanted to manage them separately.
Bad idea. We lost visibility of user acquisition as users transitioned from one site to another. For example, an SEO visit to our Blog, that later resulted in a Signup for our App would appear as coming from the Blog as opposed to SEO.
We've since pushed everything into one single Google Analytics property, with multiple views, so we can have a unified picture of users across channels and web properties.
4. We removed any internal UTMs.
When we combined all our analytics across all sites, we also removed any UTMs that we had previously had when users moved from say the Blog to our Marketing pages, so we'd have cleaner data.
5. Use UTMs on Emails and PDFS
We've added UTMs to all our emails and PDF downloads. Some email clients, as well as all PDF downloads lose referral data from links. So unless you have UTMs attached to your links in emails and PDFs, your visitors will appear as direct.
Andrew Allsop, Head of Growth Marketing at [Formisimo.com](http://formisimo.com" target="_blank) and he suggests these free tools "to help keep your UTMs organised you can use a Google Sheet like [this](https://docs.google.com/spreadsheets/d/1-gq5wxUnsPNEEnXJMn3pTRDTbQA6_0oTXn37ndyRYXY/edit?usp=sharing" target="_blank) or a UTM builder like [this Chrome add-on](https://chrome.google.com/webstore/detail/google-analytics-url-buil/gaidpiakchgkapdgbnoglpnbccdepnpk" target="_blank) to make sure you can quickly and easily keep on top of your UTM tagging."
We have a number of free PDF downloads as well as a [free data driven growth marketer email course](http://www.datadrivengrowthmarketer.co/" target="_blank) so that creates a LOT of opportunity for leads we've generated to appear as direct. But when our free course or our free PDF downloads generate customers you bet we want to know about it.
Of course measuring acquisition channels is only a part of a good marketing analytics tool stack. If you want to set up an essential stack with some key tools including channels, conversion funnels and automated customer messaging read our [7 Essentials of Marketing Analytics - a Beginners Guide](GHOST_URL/6-essentials-of-marketing-analytics-a-beginners-guide-for-startup-growth-hackers/" target="_blank).
I hope this has been useful to you, and if you’ve struggled with understanding Direct Traffic I’d love you to tell me how you tackled it in the comments below. Also, we're constantly working to improve our own metrics, and I'm sure there's more we can do, so if you've spotted anything here that we can improve on, I'll be glad to get your feedback! :)
I’ll hope to return to this post in the future with an update as we continue to work toward zero for the Direct channel, so if you don't want to miss out you should [subscribe here](http://eepurl.com/baYjsv" target="_blank).