Recently we were working with some clients, helping them look at their growth using marketing analytics. They all had revenue, and wanted to grow faster. They knew they could do better but needed help with these questions:
- "where do I start?"
- "what tactics should I use?"
- "how should I measure my progress?"
- "where should I focus?"
Maybe that seems familiar to you?
What they were missing was a solid growth strategy based on marketing experiments.
Before we get into this, I want to quickly define the difference between "tactics" and "strategy".
Click below to listen to the podcast recording, or carry on reading.
Marketing Experiments: Strategy and Tactics
Now, theres a world of difference between tactics and strategy, so let's be clear: tactics are what you will test, but strategy is how you will systematically organise your work for success. And trust me, you need a strategy. Not just any strategy, but a disciplined application of marketing experiments.
As Sean Ellis (CEO of GrowthHackers.com) says,
"Growth Hacking IS Experiment Driven Marketing".

Here's the step-by-step strategy we used, and you can use this very same strategy today. Lets get started!
Step 1: Model your Conversion Funnel using Pirate Metrics
To get an initial model in place, we sketched out their current sales funnel based on the five stages of Pirate Metrics: Acquisition , Activation , Retention , Referral, Revenue.
I've written about Pirate Metrics and Marketing Analytics before, and the value of this is simple and visual model, is that it goes beyond landing pages and considers actual use of the product/app/service.
Ask yourself to put in a percentage to represent each stage as follows: if 100 new visitors arrive from whatever channel how many would sign up (Activation) how many would return and get value from the product (Retention) how many would share or invite others (Referral) how many would become cash generating for the business (Revenue).
Step 2: Pick ONE area of Focus
When you map out these five stages you can usually see pretty quickly where the biggest problems are - and hence where to focus.
In our customer work, the common areas were to work on tend to be: Activation (to improve the rate of customers signing up the other was to improve) and Retention (to help the customers who had signed up use their product or service through a process of on-boarding and engagement to help new users get sufficient value that they would then become paying customers).
Every business is different and while this process is applicable to any of the 5 stages in Pirate Metrics, I'll focus here more on Activation and Retention.
Step 3: Brainstorm Ideas
Now that we figured out where to put our efforts the next stage is to brainstorm ideas to improve. Come up with a list of ideas that you and your team think could perhaps make a difference. For example:
- we think a video landing page will better explain our product
- we could change the text we use on our landing page to explain our product
- if we help our users understand better how to use our product they would get more value, which might lead to ideas around creating more help or demo videos or email marketing to new users to help educate them.
Often teams have a bunch of ideas already, but if you need inspiration, I've add some resources below to get you started.
Ideas for Brainstorming - ACTIVATION: There much work around optimising Landing Pages (thanks to Moz.com) and here's some brutally honest landing page critiques from the guys at Unbounce.com.
Ideas for Brainstorming - RETENTION: To give you food for thought, there are specific strategies you can use focus on Customer Retention,
Step 4: Prioritise Ideas for Marketing Experiments
Sort your list of ideas and prioritise to the top three that you think could make a difference. Look for quick wins. Look for easy fixes. Get inspiration from other businesses that you are a fan of. Where did you last signup for a service? How did they convince you? What was their landing page like? What onboarding emails did they send you?
Step 5: Write a Hypothesis for each of your Marketing Experiments
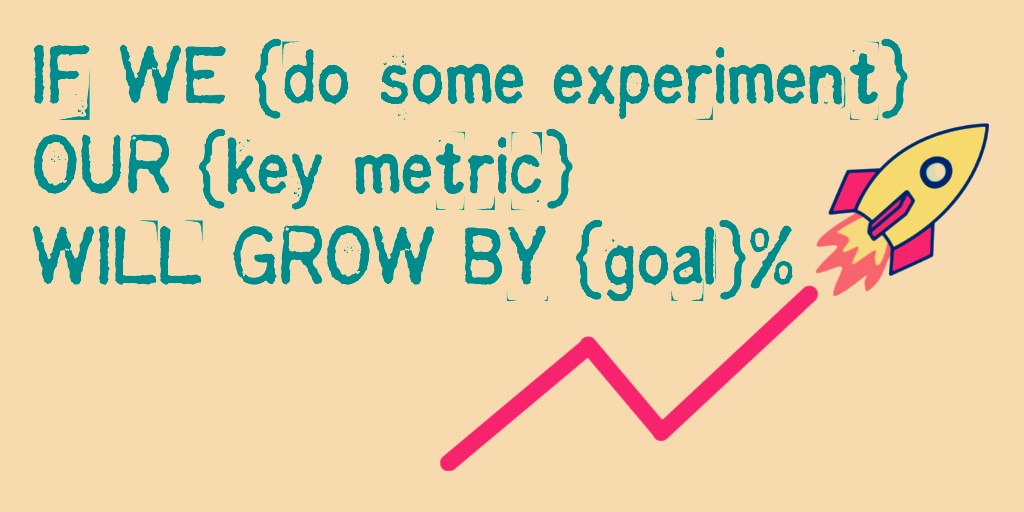
For each prioritised idea, write a simple hypothesis that says something like this:
If we [TAKE SOME ACTION] our [KEY METRIC] will increase by [GOAL]%

Examples:
-
"if we add a explainer video to our landing page our activation will increase by 5**%**"
-
"if we send triggered emails to users to encourage them to add their pet name and photo our user retention will increase by 5**%**.
Step 6: Measure your Baseline for each Experiment
Before you start, you need to know your current state. That way you can measure your progress. Tim Wu, Director of Growth at Framed.io says: "Experiments need a baseline, so you can measure results, otherwise you're just spinning your wheels".
"Experiments need a baseline, so you can measure results, otherwise you're just spinning your wheels."

One way, to get a baseline, is to set up a conversion funnel that gives an overview of the business, based on those 5 stages of Acquisition, Activation, Retention, Referral, Revenue, and shows the Conversion Rate for each key stage. Now you can watch how your conversion rate changes as you run your experiments.
Tools you can use include Mixpanel and KISSmetrics which make this easy, and unless you have loads of traffic they are inexpensive (often with a free tier), and assuming you aren't a coder or don't have easy access to your app code, you can setup user events tracking without coding by using a visual setup tool.
BONUS (Tutorial): Here's a tutorial to show you how to set up your funnel in under 5 minutes
Step 7: Tactics: Run Your Marketing Experiments
The next step is to design and run the marketing experiments. This is our science lab. Here we're testing and measuring individual tactics, to find what works, or as Bronson Taylor of GrowthHacker.TV says, "Growth hackers scientifically test new tactics".

There are a variety of tools which can be used for example if you want to AB Test changes to a landing page tools, Visual Website Optimizer and Optimizely make that very easy.
If you have access to developer resources and you want to make larger changes then Google Experiments is very helpful to split traffic to two very different pages.
Step 8: Double Down on Winners, and Repeat
Don't just accept the first improvement - keep pushing to improve that one part of your business. Systematically work through the rest of your hypotheses until you run out of ideas for things to improve (eeek!) or this metric stops improving.
Once you have improved that part significantly than you can repeat the process from Step 1.
Learn what works
It doesn't matter whether an individual marketing experiment succeeds or fails because in either case you will learn.
For example, if you tested five different phrases for the headline text of your landing page, and none of those texts made a difference then already you will have learned these are not the words to use to ring in the minds of your customers when they think about their problems that your product solves - and that's valuable information, because you know those words may also not work in your traction channels.
Move Fast
Speed is of the essence the faster you can complete an experiment, the faster you can learn what works for your business. Knowledge can be a strategic advantage in any business (and hard to replicate), so if you can outlearn your competitors that is a huge advantage.
A self-sufficient Marketing/Growth Team
When you design marketing experiments and metrics, you need to be as self-sufficient in your marketing/growth team. If you need to stop and wait for engineering resources, that can really slow your progress while you wait for a tests to start.
"Growth Hacking is experiment-driven marketing executed by people who don't need permission or help to get things done." (Rob Sobers)

Use visual tools as much as possible:
- VWO & Optimizely are visual tools for A/B Testing.
- Mixpanel & KISSmetrics are visual tools for reporting.
- Intercom.io, Customer.io and Trak.io are visual tools for sending engagement & retention emails.
- Popcorn Metrics is a visual tool for tracking user events and driving user data into other tools for automation and segmenting.
Document your Marketing Experiments
By recording all your experiments, you can then review what works, and that can help you spot and reuse patterns that work. For example, the text that works best on your landing page may also work best in your traction channel messaging. Here's a few ways to keep track:
- Use a simple spreadsheet with Kurt Braget's PILLAR Formula.
- Visualized pipeline with Rob Sobers Growth Hacking Trello Template.
- You can even use something as simple as a Google Spreadsheets document with one marketing experiment per row. If you click here to share this article I'll give you instant access to our Experiments Catalog Google Template.
Develop the habit of Experimenting
This pattern of running marketing experiments is continuous, it never stops. So you need to start developing the habit across your team. Everything I have outlined here is straightforward, but the key to success with this strategy is the scientific approach and disciplined execution. Make it a part of your team's work process.
An overall marketing analytics strategy
The strategy I've outlined here is part of an overall marketing analytics strategy, to improve your business using data, creativity and a scientific approach. It combines the use of marketing analytics tools with a process driven strategy to enable you to focus on specific parts of your business and iterate for continuous improvement in growth.
For consultation and advice on creating a conversion strategy for your own business, schedule at least a 15-minute meeting with me via YoucanBookMe.
My thanks to Tim Wu at Framed.io and Al Mackin at Formisimo for editorial review.
Was this post helpful? Please let me know your thoughts in the comments section below.
 Popcorn Metrics